ERIC Metrics Report Generated for: Higher Education Studies
Posted on May 5, 2023
This report shows the number of views of the ERIC records for your content and the number of PDF downloads if you permit the full text to display in ERIC.
These statistics are for the six-month period from July 1, 2022 to December 31, 2022.
- A view is counted whenever a user accesses the abstract.
- A download is recorded whenever a user opens the PDF attached to the ERIC record.
This report is only for your content hosted on the ERIC digital library of education research at https://eric.ed.gov. It does not include the views at third-party providers of ERIC or at the publisher's website. You can learn more about the metrics report in this video: https://www.youtube.com/watch?v=Z9-5yRKMW5o.
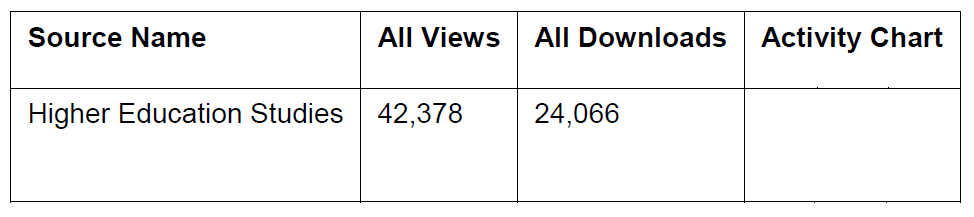
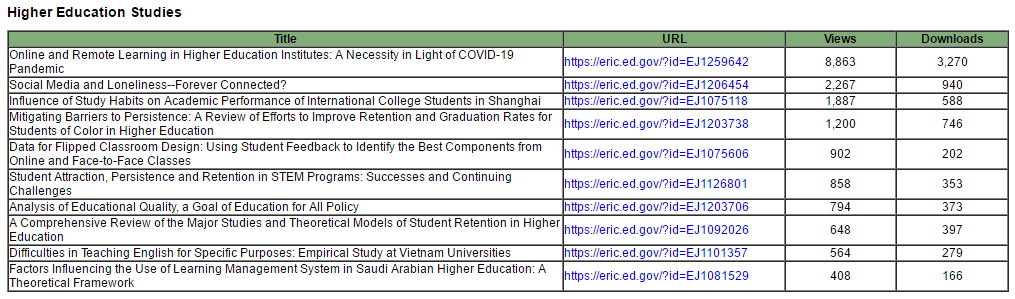
The first table shows the total visits and downloads for your currently indexed source(s). In the "Views and Downloads" column the total views are visualized in green and downloads in blue. The table is followed by a list of up to ten (10) articles or document titles with the most total views for each source. We are unable to give statistics for all articles.
- ISSN(Print): 1925-4741
- ISSN(Online): 1925-475X
- Started: 2011
- Frequency: quarterly
Index
- AcademicKeys
- CNKI Scholar
- Education Resources Information Center (ERIC)
- Elektronische Zeitschriftenbibliothek (EZB)
- EuroPub Database
- Excellence in Research for Australia (ERA)
- Google Scholar
- InfoBase
- JournalSeek
- Mendeley
- Open Access Journals Search Engine(OAJSE)
- Open policy finder
- Scilit
- Ulrich's
- WorldCat
Contact
- Sherry LinEditorial Assistant
- hes@ccsenet.org